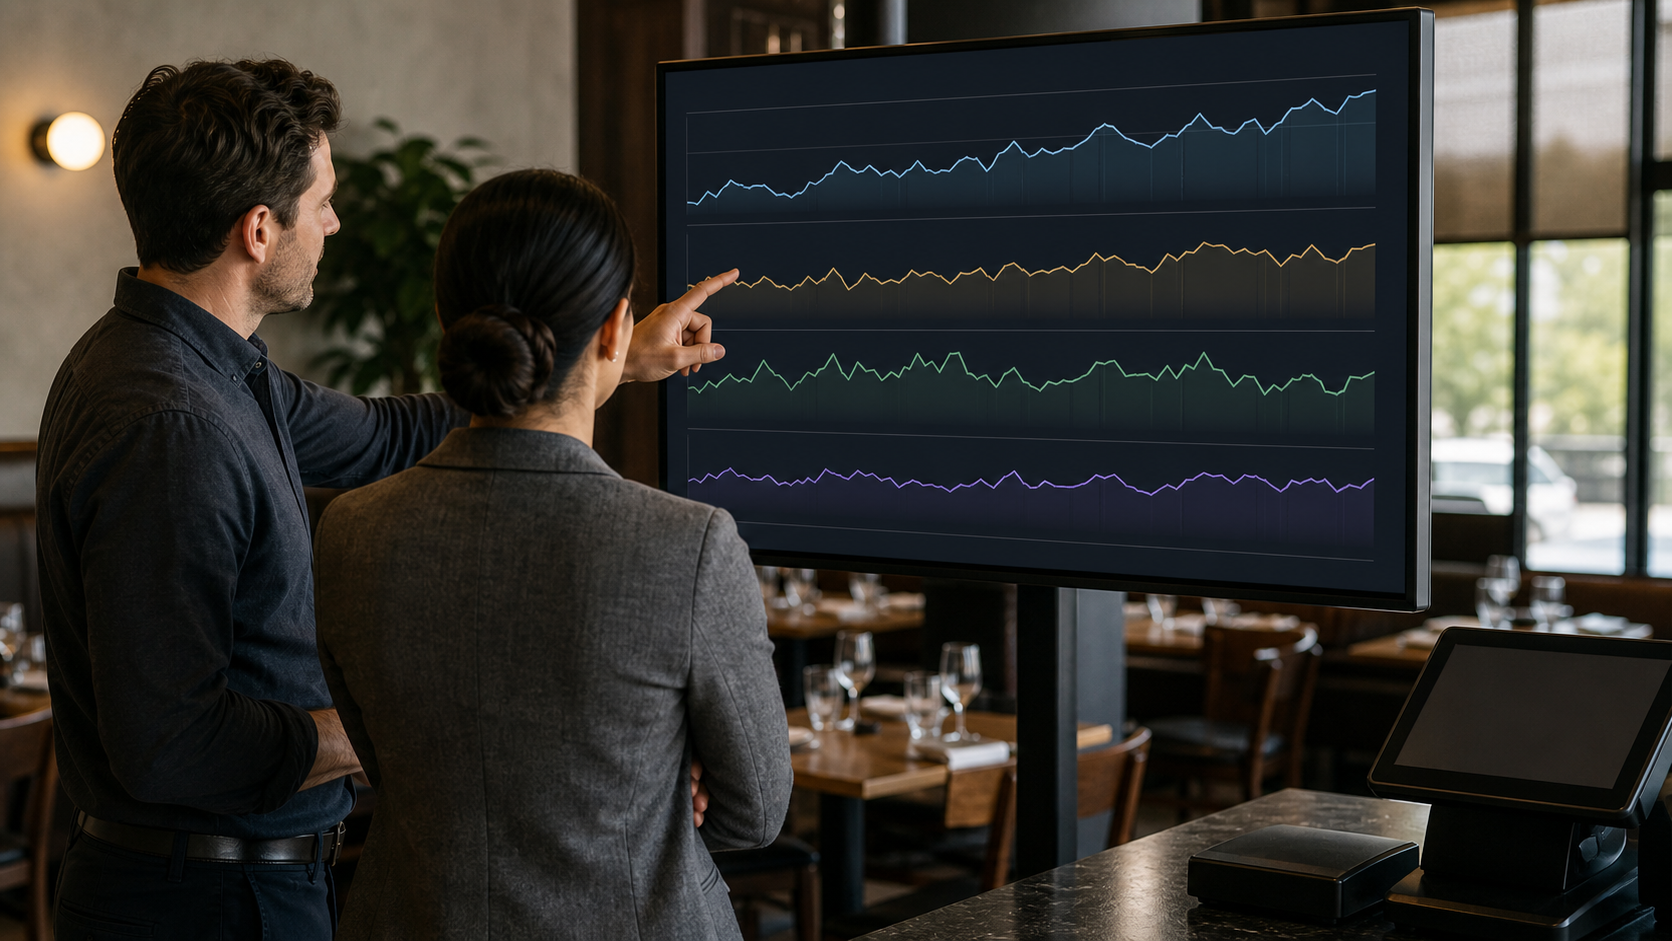
Three current signals, one local question
July releases provide useful context but no single answer for a restaurant. The Census Bureau’s current monthly retail release tracks broad food-service sales. USDA’s July 24 Food Price Outlook reports that food-away-from-home prices remained higher than a year earlier. The National Restaurant Association’s latest jobs analysis shows a choppy first half for restaurant employment.
Review the neutral current context from the U.S. Census Bureau retail release, the USDA Food Price Outlook, and the National Restaurant Association jobs analysis.
Those signals help frame a review. The decision still depends on location-level evidence: transactions, guests, price, mix, daypart, channel, labor, and service outcomes.
Combine the operating signals with the ServingIntel Genesis platform.
1. Split revenue into price and volume
Compare same-location revenue with transactions, covers, and units. If revenue grows faster than visits or orders, identify how much came from average check, price, mix, fees, or channel. Do not label price-led growth as traffic growth.
Use comparable dayparts and weeks. Remove closures, holidays, promotions, large catering orders, and one-time events before setting a new baseline.
2. Measure mix before averages
Average check can rise because guests bought more, moved to higher-priced items, shifted to delivery, or paid a new fee. Break the change into item count, category mix, modifier mix, discounts, taxes, tips, and channel costs.
Use ServingIntel News & Insights to keep external context separate from the location scorecard.
3. Compare dayparts and channels
A weekly total can hide a weakening lunch, stronger weekend dinner, lower dine-in traffic, or higher delivery volume. Benchmark every major daypart and order channel against its own history.
Require a clear location and channel identifier in every record. Unattributed transactions should appear as an exception, not be silently spread across the report.
Pair the benchmark with the 86 the POS labor-market playbook when demand changes affect staffing.
4. Put labor beside demand
Review labor hours, sales per labor hour, transactions per labor hour, ticket time, and coverage-floor compliance together. A labor percentage can improve while waits, mistakes, and manager overrides rise.
The operating benchmark should reward sustainable throughput, not simply fewer scheduled hours.
Confirm device and station assumptions with ServingIntel hardware guidance.
5. Treat exceptions as demand evidence
Track voids, refunds, comps, cancellations, sold-out items, payment failures, delayed orders, and guest recovery. These events explain why gross demand did not become completed, profitable demand.
Reconcile the supporting record with the SI Receipt capture-control checklist.
6. Build a four-week comparable trend
Show the current week, prior week, comparable week, and trailing four-week median. Flag material changes but require a written explanation before an alert becomes an action.
- Revenue, transactions, covers, and average check
- Item count, mix, discounts, and refunds
- Daypart and channel contribution
- Labor hours, throughput, ticket time, and exceptions
- Known events, outages, closures, and promotions
7. Predefine the operating response
For each metric, name the owner, review cadence, decision threshold, and allowable response. A traffic decline might trigger a local marketing review. A channel shift might trigger a capacity or fee review. A rise in errors should trigger workflow correction before a promotion.
Keep escalation and recovery ownership available through ServingIntel support resources.
The benchmark
Revenue is a result, not a diagnosis. A useful July benchmark explains whether the change came from demand, price, mix, channel, labor, or exceptions—and identifies the controlled response before the next weekly review.